Watershed Delineation Tutorial

Header Image of old City of Fort William map sheet showing the Kaministiquia River.

This tutorial for delineating watersheds combines traditional methods of drawing watershed boundaries on paper maps using contour lines, and digital spatial data within a Geographic Information System (GIS). There are more automated methods within a GIS but the availability of sufficiently detailed digital elevation models (DEM), potential errors that need to be anticipated, and the complexity of initializing the data model make these methods beyond the scope of this tutorial. Using a more manual method reinforces the theory of watershed delineation, and will provide a practitioner with the ability to discern whether the results of more automated methods are reasonable or not.

The video tutorial assumes that you have QGIS installed. For a link to the QGIS download site, click here. QGIS is an excellent open source GIS application with many additonal plugins to extend the functionality, and is highly recommended.

NOTE: QGIS 3.2 for Windows was recently released. Release notes indicate that it is substantially different from previous versions. I am excited to try out the new 3.x versions but for the purposes of this tutorial I recommend the the older stable 2.18 release.

Important Links

A quick introduction to the Ontario Flow Assessment Tool

The Ontario Flow Assessment Tool (OFAT) is useful for comparing results of other watershed delineation methods and for gaining additional information about watershed parameters and landcover, for example. (Please click here for detailed OFAT specifications and instructions.) To quickly create a watershed and try the tool please follow the instructions below:

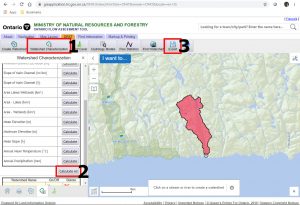
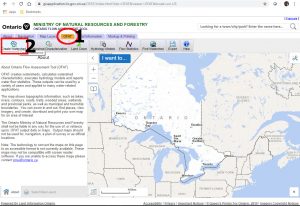
Search for OFAT. A direct link to the tool should be one of the first returns in the search engine. From the home page, after reading and agreeing to the licensing agreement, first click on the OFAT tab and then the "Create Watershed" button.

Create watershed with Ontario Flow Assessment Tool

Once you click on "Create Watershed" it is possible to enter coordinates for the pour point of the watershed. (The pour point refers to the outlet for a particular drainage basin/watershed. In this case you are choosing the outlet and asking the tool to determine, using a digital elevation model, to show the area that drains to that outlet.) It is often easier to drop the pour point directly on the map. This requires you to zoom in on your area of interest until the "Create from Map Point" button is no long grayed-out.

Create watershed pour point from a point on the map.

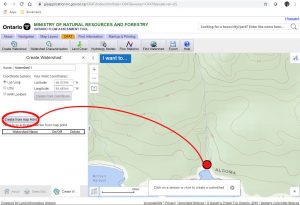
Once you create a pour point on the map, it will take a few minutes for the tool to calculate the watershed. You can then click on the "Watershed Characterization" button to calculate watershed area, slope, etc. In order to download the information in tabular form, click on the "Export" button. Please note that you can also ask OFAT for land cover data, flow statistics and to run hydrology models. When you export, in addition to tabular data, you can also download the watershed as a shapefile that can be opened in a GIS.

Procedure for calculating watershed characteristics and exporting.


Downloading NTS map sheets and Digital Spatial Data


Geospatial Data Centre (GDC) topographic maps

The topographic map sheets in the Geospatial Data Centre (Map Library – RC2001) are part of the National Topographic System (NTS) of Canada. We do not have every map sheet for Canada, but they are all available as digital versions.

The digital versions and paper versions are essentially identical. When printed on paper the scale ratio (1:50,000) is accurate (allowing for small variations across the map sheet due to the specific map projection). In the digital version, where you can zoom in and out, this ratio is no longer valid. The scale bar varies in size in proportion to the map sheet as you zoom in and out and so can be used regardless of the level of magnification. On the paper maps the distance between the grid lines is two centimeters, representing one kilometer on the ground. This fact can also be used to compute distances and area.

Access Digital topographic maps

The Download Directory and Documentation Page of NRC gives access to most available geospatial data in Canada:

https://www.nrcan.gc.ca/earth-sciences/geography/topographic-information/download-directory-documentation/17215. Click here to open the Download Directory page.

You first need to determine the map sheet(s) that you need for you study area. Go to the Topographic Maps section and click on Index Maps of the NTS of Canada. If you use Google Earth, then download the KML file and open it. When you click on the area you want, the specific map sheet comes up with the download links to .pdf and .tif versions of the map.

Without using Google Earth we can choose the index in PDF format. For example, to find the map sheet for Sarnia, ON, I would click on “Access”, then choose the Ontario index map; navigate to the Sarnia area and zoom in (Ctrl and scroll wheel); determine that I would need map sheets 40 O/1 and 40 J/16.

NTS index added to Google Earth and used to determine map sheet for study area
Using PDF index to determine map sheet numbers

Once you know the map sheet(s) you need, go back to the Topographic Maps section and click on Digital topographic raster maps. 1:50,000 is the largest scale map series to cover the entire Canadian land mass and so we can click on “50k/” to find the map sheet(s) that we need. To find the 40 J/16 sheet for the Sarnia, ON area we would drill down through the directory by clicking on 50k/, 40, j, 16. There are 3 formats available:

  • pdf would be the best version to choose in order to print out the entire map sheet. You could get a high quality version that would be the same as an existing print copy.
  • tif format is best for opening in a graphics program or for printing out just a section of the map sheet. A graphics program like Adobe Illustrator or Inkscape (open source) would allow you to draw a watershed in a very similar manner to tracing over a hard-copy map.
  • Geotiff format is georeferenced. You could bring the map into QGIS, for example, and then use a similar process to the tutorial above, to draw a watershed (Start video at approx. 12:00).

NTS vector data

Another option is to use spatial vector data in a GIS. This is the same information used to create the paper topographic maps and theoretically you could recreate them with enough time and skill with a GIS application.

To download this data search for GeoGratis, click here or go to:

http://geogratis.cgdi.gc.ca/

Under Geospatial Applications and Tools, click on the Geospatial Data Extraction tab which opens the Geospatial Data Extraction application. This online application allows you to specify a custom mapping area for download; this eliminates the problem of your study area being on 2 or more maps sheets.

Setting study area for downloading CanVec data
Download settings for CanVec data
  • Select clipping area – the easiest thing to do is zoom into your study area and then use the Current Map Extent. (Note: experience shows that you should usually select a larger area than you think you need. It is time consuming to go back to this stage when you find that the watershed of interest extends 100 m further than your data.)
  • Select Data to be extracted – choose CanVec. If you Select all, there are more than 60 feature layers to sift through.
  • Output format – ESRI Shapefile is a standard format that is portable between most GIS applications
  • Select a coordinate system – This is an advanced topic. In general it is best to use a Universal Transverse Mercator (UTM) projection for study areas on a local scale. However this would require you to download in geographic coordinates (like NAD 83 CSRS) and then project this data yourself in a GIS. Therefore, I would recommend downloading in WGS 84 / Pseudo-Mercator (EPSG: 3857) for the simple reason that the planar units are meters. This would allow you to accurately measure distances and area, in a manner similar to using UTM, and does not require the extra step of projecting from geographic coordinates.
  • Clip the data  and select the 1/50,000 scale
  • After submitting your request, you should receive an email within about 5 minutes with a zip file of the data

The beginning section of the Watershed Delineation video tutorial illustrates adding vector data to QGIS.